From Print to Digital: Making Weekly Flyers Shoppable at Instacart Through Computer Vision and LLMs

Key contributors: Prithvi Srinivasan, Shishir Kumar Prasad, Kristen Morgan, Bryan Pham, Rick Shukla, Preeti Chadha, Vipul Bahubali, Ahmad Sajedi, and Ali Maleky
Introduction
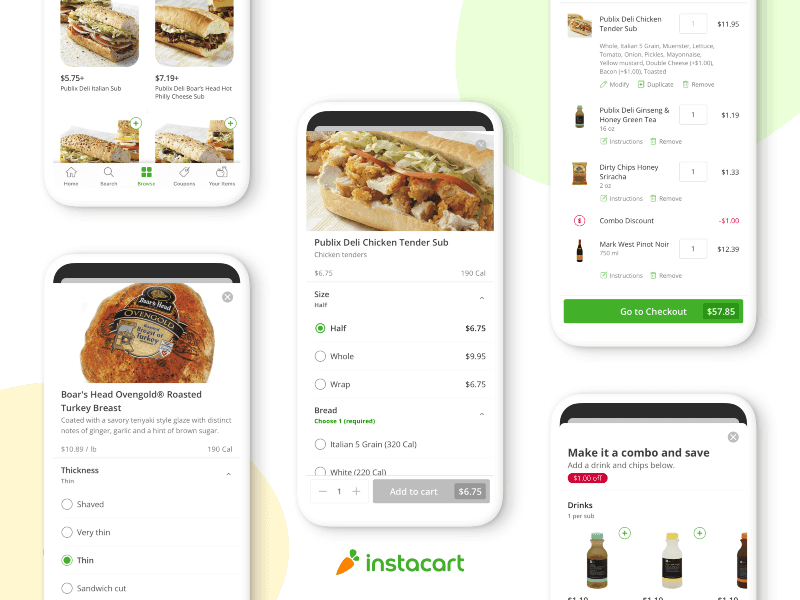
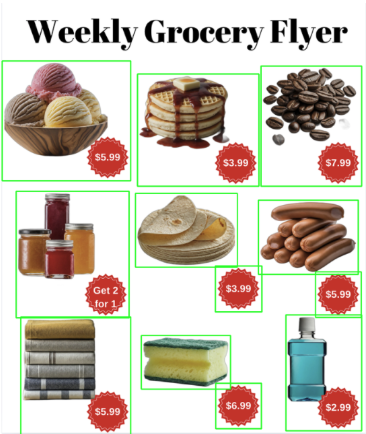
Grocery flyers have long been a cornerstone of retail promotions, from paper inserts in the newspaper to email blasts featuring weekly deals. As more grocery shopping shifts online, however, these static promotions haven’t kept pace with customer expectations for convenience and interactivity. At Instacart, we recognized the opportunity to transform static promotional content into interactive, shoppable experiences.
In 2024, we launched grocery flyers on our platform[1], enabling retailers to upload their weekly and monthly promotions. This enabled our customers to browse through weekly deals for their favourite retailers, providing easy ways to save.

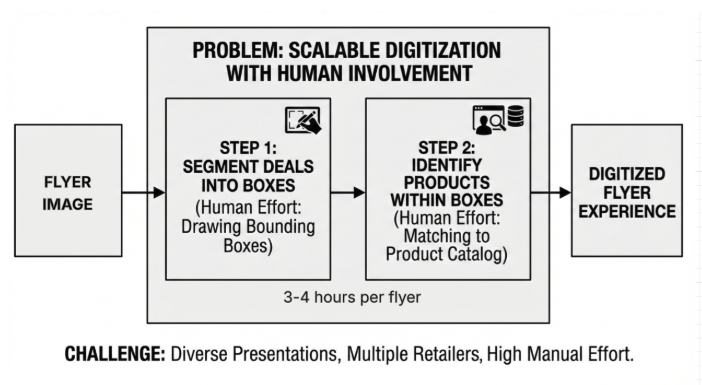
Customers expect digital flyers to look and feel like the physical versions they’re used to, with the added ability to tap on items and shop directly. To deliver that experience early on, we relied on a manual digitization process. This involved drawing bounding boxes around every deal and accurately matching those deals to products to our catalog — a painstaking task that required 3–4 hours per flyer.
As the feature gained traction with retailers, this manual approach quickly became unsustainable. With dozens of retailers uploading weekly flyers, our team faced a mounting workload of hundreds of hours each week. The manual process also required the retailers send us the flyers well ahead of time so we could process them before the deals went live.
With multiple retailers eager to adopt weekly flyers, we needed a scalable solution that could handle the complexity and variety of flyer designs from simple grid layouts to complex promotional spreads featuring everything from branded packaged goods to fresh produce. Each flyer presented unique challenges in product presentation and layout, making it clear that a one-size-fits-all approach wouldn’t work.
While existing solutions like FoodSAM[2] showed promise for food-specific segmentation, they fell short of addressing the breadth and variety of products featured in retail flyers. It became clear we needed a purpose-built approach: one that combined state-of-the-art computer vision models with custom algorithms tailored to the unique challenges of grocery flyer digitization.
Our Approach: A two phase pipeline
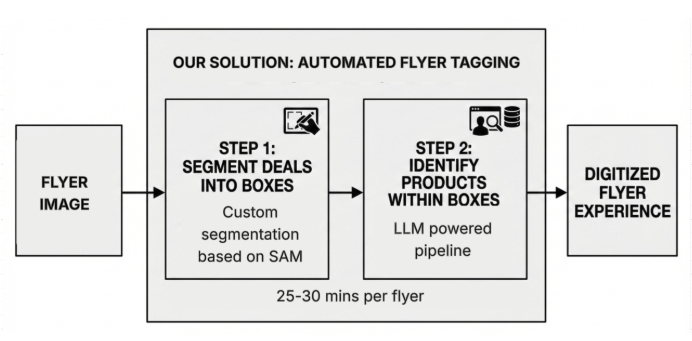
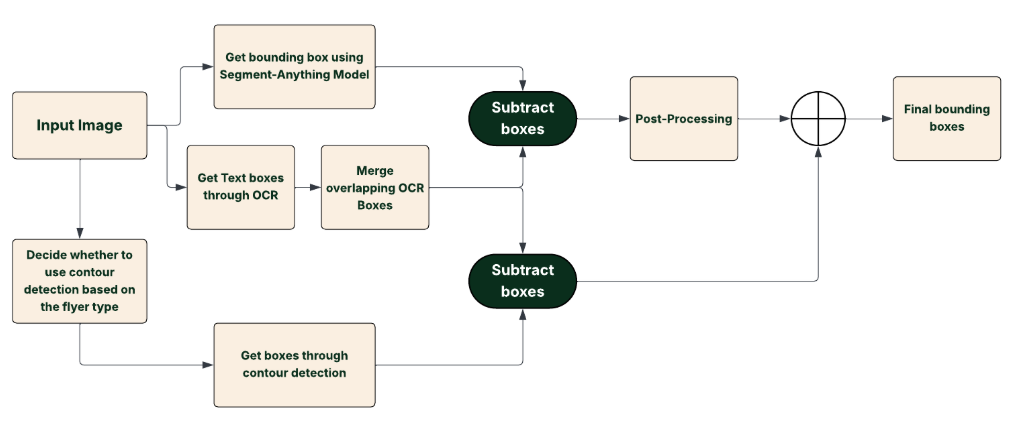
We developed a two-phase pipeline as seen in figure 3 to transform static flyer images into interactive shopping experiences. The entire process now takes less than 30 minutes once a flyer is uploaded, a dramatic improvement from the 3–4 hours of manual work previously required.
Phase 1: Image Segmentation — Identifying and extracting bounding boxes around each product or deal on the flyer. This phase uses a custom algorithm built on Meta’s Segment Anything Model (SAM), enhanced with techniques to handle the unique challenges of retail flyers: overlapping products, decorative text, varying layouts, and products of all sizes.
Phase 2: Product Identification — Matching each segmented box to actual products in our catalog. This phase leverages optical character recognition (OCR), large language models, and our existing search infrastructure to accurately identify products and their attributes, even when deals feature multiple items or generic produce.
Phase 1: Image Segmentation
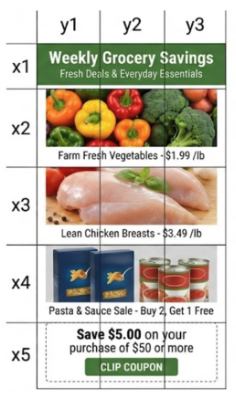
The first step in digitizing flyers is image segmentation. Initial experiments with off-the-shelf ML solutions to extract bounding boxes around each deal revealed significant limitations. Vision Language Models (VLMs)[3] or multimodal LLMs work for very simple flyers where the boxes are well separated and few in number. For simple flyers we iteratively ask multimodal LLMs where each box begins (X & Y coordinates) by drawing uniform grid lines as shown in figure 4 below. Once we identify the first coordinates we divide the selected box into smaller boxes to find the starting and ending coordinates for each segmentation box. We achieved a high accuracy (~90%) for simple flyers through this method.
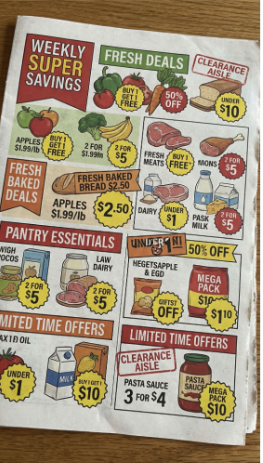
However, for more complex flyer images like seen in figure 5, multimodal LLMs produce imprecise bounding boxes. Traditional segmentation and contour detection models generated excessive noise, rendering their outputs unusable without extensive post-processing. These challenges led us to develop a hybrid approach that leverages the strengths of multiple techniques while addressing their individual weaknesses.
Our solution builds upon Meta’s Segment Anything Model (SAM)[4] as a foundation, but it requires custom techniques to denoise smaller boxes, merge multiple products belonging to the same deal, remove text-only boxes, and more:
Text Box Removal
Flyers often contain decorative elements and promotional text that don’t correspond to specific products. Our system intelligently identifies and removes these extraneous elements, ensuring our segmentation focuses exclusively on product-related content. This preprocessing step significantly improves the accuracy of subsequent stages.
Box Merging with Weighted Boxes Fusion (WBF)
To consolidate overlapping detections and improve localization accuracy, we employed the Weighted Boxes Fusion (WBF)[5] technique. Unlike traditional Non-Maximum Suppression (NMS), which may discard valuable information by eliminating lower-confidence boxes, WBF combines all overlapping boxes by computing a confidence-weighted average of their coordinates. This approach retains more information and often results in more precise bounding boxes.
WBF has demonstrated significant improvements in various applications. For instance, in medical imaging, combining outputs from multiple detectors using WBF has led to an increase in mean Average Precision (mAP) by approximately 3–10% over the best single model. Similarly, in our application, merging nearby boxes that likely represent the same product enhances detection accuracy and reduces redundancy.
Model Ensembling
To leverage the strengths of different detection approaches, we combined outputs from segmentation models and contour detection algorithms. The decision whether or not to use contour detection models was based on how densely the flyer images were packed. This varied from retailer to retailer. This ensemble strategy allows us to capture a broader range of product representations, as different models may excel in detecting various features. By integrating their outputs, we achieve a more comprehensive and robust detection system.
Filtering with Heuristics and Machine Learning
Post-processing is crucial to eliminate false positives and refine detections. We applied a combination of heuristic rules, such as filtering based on the relative size and aspect ratio of bounding boxes, and machine learning-based filters trained to distinguish between valid product boxes and noise. This dual approach ensures that only the most relevant and accurate detections are retained for further processing. By combining these methods, we’re now able to accurately extract most of our targeted bounding boxes.
In the images below, you’ll see how some of the out of the box approaches work in comparison to our developed algorithm. Below in figures 7–9 you can find the image processed through the LLM multimodal model, the image after processing with Meta’s Segment Anything Model, and the final image after running through our algorithm.
In figure 7 below you can see flyer segmentation through a multimodal LLM as a one-shot approach. This renders the coordinates unusable.

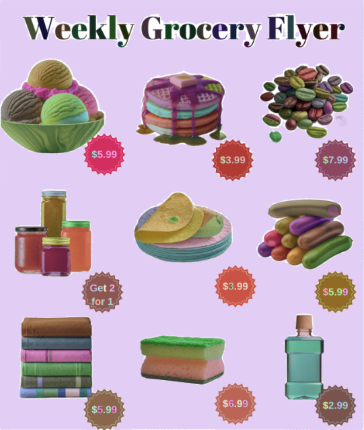
In figure 8 below, you can see flyer segmentation with Segment Anything Model (SAM). This renders too many noisy boxes. The off the shelf model is designed to segment to the smallest segment possible without context of grouping. For example, each coffee bean and scoop of ice cream is rendered as a separate segment or box shown by the different colors assigned in figure 8 below. This leads to complexities while trying to fuse the boxes.
In figure 9, below, you can see the accuracy of the custom pipeline.
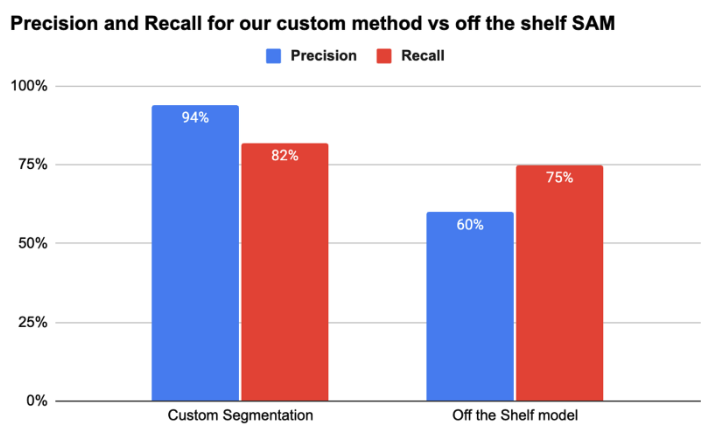
By combining these techniques, we’re now able to accurately extract 75–90% of targeted bounding boxes depending on flyer design, with significantly higher precision than any single off-the-shelf solution.
Phase 2 — Image to Product Identification
The second step of this process is to identify the elements or products within each box. We wanted to use the power of our existing Search infrastructure to identify elements within the image instead of reinventing image-based search from scratch. Instacart’s search algorithm[6] uses a two-tower algorithm with query features and product features to find the top matching products for any given query.
To transform image information into queries that are similar to Instacart searches and match attributes from the image to the product catalog, we developed a way using Optical Character Recognition (OCR), LLM, and our Search ANN (Approximate Nearest Neighbors) cluster to get a highly precise match for every item on the flyer.
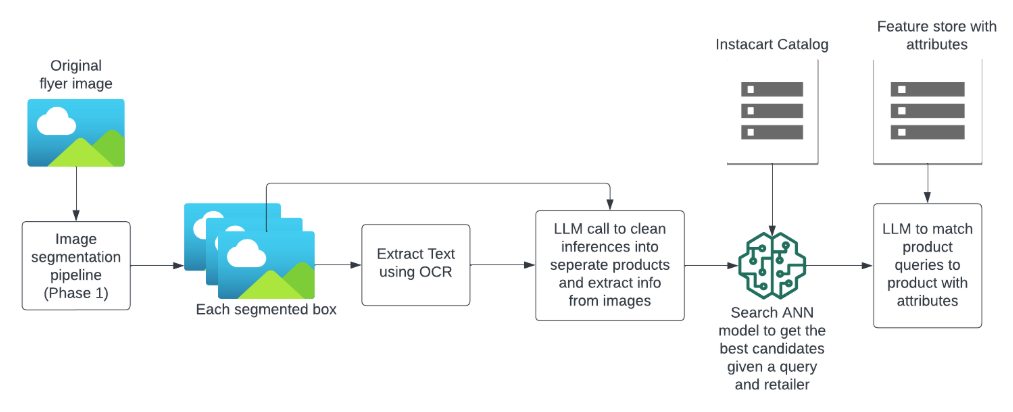
We use PaddleOCR[7], a state-of-the-art OCR model, to identify text on images and extract text from the image. We pass this output along with the original image to an LLM model to separate deal images into queries and attributes for each product, as some deals might contain multiple products. We have noticed that adding the output of the OCR model increases the find rate of products by 15% on average.
Next, using our Search Approximate Nearest Neighbors Algorithm (ANN), we are able to find the top 10–15 products that match the product query embedding. To complete our matches, we retrieve product attributes stored in our Instacart feature store and use LLM to rank the matches based on the matching attributes. This step of the process also helps us to eliminate noisy boxes from the segmentation step, which might not contain products in them. This part of the algorithm has a 95% recall of finding the product in the top position.
Together, these techniques deliver transformative improvements to our workflow. What previously required 3–4 hours of manual effort per flyer, drawing bounding boxes and matching products can now be reviewed and finalized in just 30 minutes. This represents a 10x reduction in processing time, enabling us to scale flyer digitization across our entire retail network.
Future directions for flyers
Our work on digital flyers demonstrates how combining multiple AI approaches can solve complex real-world challenges. By integrating SAM, contour detection, OCR, and large language models with our existing search infrastructure, we’ve transformed static flyer images into interactive shopping experiences. This approach opens up opportunities for new retail experiences and deal discovery for customers, while also laying a foundation for future exploration of time-saving innovations in retail AI.
References
- https://www.instacart.com/company/updates/new-ways-to-save-on-instacart/
- https://arxiv.org/abs/2308.05938#:~:text=,detector%2C%20which%20renders%20FoodSAM%20to
- https://huggingface.co/blog/vlms
- https://segment-anything.com/
- https://arxiv.org/abs/1910.13302
- https://www.instacart.com/company/how-its-made/how-instacart-uses-embeddings-to-improve-search-relevance/
- https://github.com/PaddlePaddle/PaddleOCR
Instacart
Author
Instacart is the leading grocery technology company in North America, partnering with more than 1,800 national, regional, and local retail banners to deliver from more than 100,000 stores across more than 15,000 cities in North America. To read more Instacart posts, you can browse the company blog or search by keyword using the search bar at the top of the page.